Ok, so the title of this blog post might be somewhat on the dramatic side, but it is true that the key to any successful modern marketing campaign is analytics. The same can be said for any campaign driven through social media or social ads; I’m sure you already know Facebook includes “Insights” for each business page but . Insights will allow you to measure your effectiveness using some metrics that are unique to Facebook alone. metrics.
Facebook insights give you a clear explanation for the increase or decrease in traffic to your page or your social content. Some of the most relevant key performance indicators tracked by Facebook insights includes:
- Most popular posts.
- Likes/Unlikes.
- Overall reach & engagement.
- Demographic breakdown (Age, location, sex, etc.)
So now that we know that Facebook insights exists, how do we use them to optimize and guide our communication strategy and tactics? Let’s walk through things right now and discuss a little bit about how we can use these analytics to our advantage.
How to access your Facebook Insights
Once you sign in to Facebook and select the company page whose analytics you’re looking to track, the page will look slightly different than a usual Facebook profile page, you will find these different categories located at the top of your brand page.
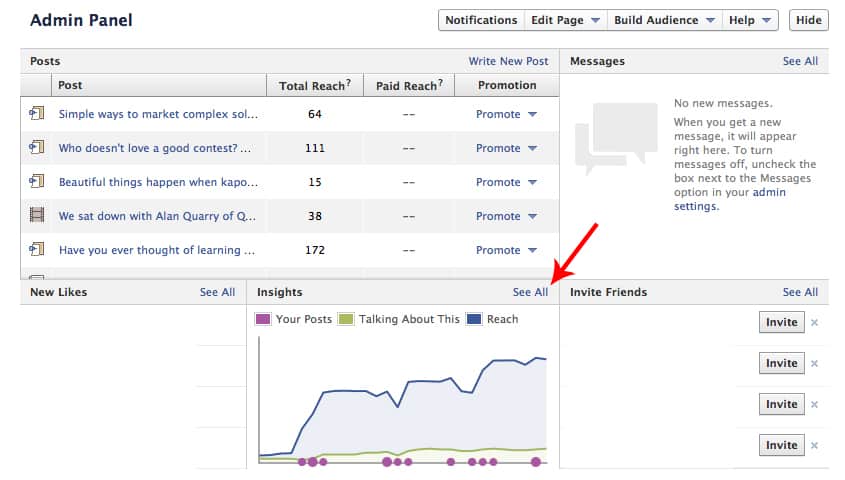
By selecting “See All” on the Insights tabs this will take us to the Insights dashboard. There’s some serious information throughout your dashboard, so let’s walk though some of the most important metrics that will get us on the road to optimizing our social communication schedule.
The Overview a.k.a The Big Picture
This is now where all your Facebook data can be found. Anything from the amount of total Likes, how many people are talking about your post and the total reach your post is receiving will be displayed in this part of the analytics tab.
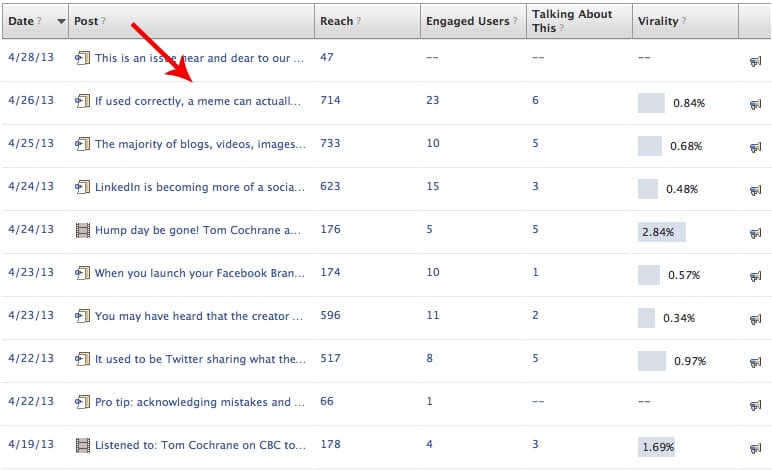
Once you have noted the analytics displayed at the top of your page and would like to dig deeper into individual posts that are creating engagement, scroll further down the page to view each post that has been displayed to your companies Facebook page. One thing to keep in mind in this section is identifying the type of post each is.
![]()
From here you can easily view the date each post was posted, its content, the amount of total reach and how many of your follower actually engaged with that post. If you see posts that aren’t getting the engagement you thought it might, you may want to compare it to other posts that are getting positive engagement – Find out what was different and how you can change similar posts in the future to increase their engagement.
Most Popular Posts
Once you are done examining your content that has been published over the last week or month, head back up the top of the page to view the activity of your Likes and Reach throughout a specified date range.
We’re going to delve into the details of Likes, Reach, People talking about this and Checkins in a moment. I just wanted to step back for a second and lay the foundation of this insight. When you post content to your Facebook page, it’s important to understand that typically a small fraction of your fans will see your content. When you create engaging content that spurs interaction it also increases the number of people who will organically see your posts in their timeline.
This is why engagement is key and this report is one of the most important contained in Facebook Insights!
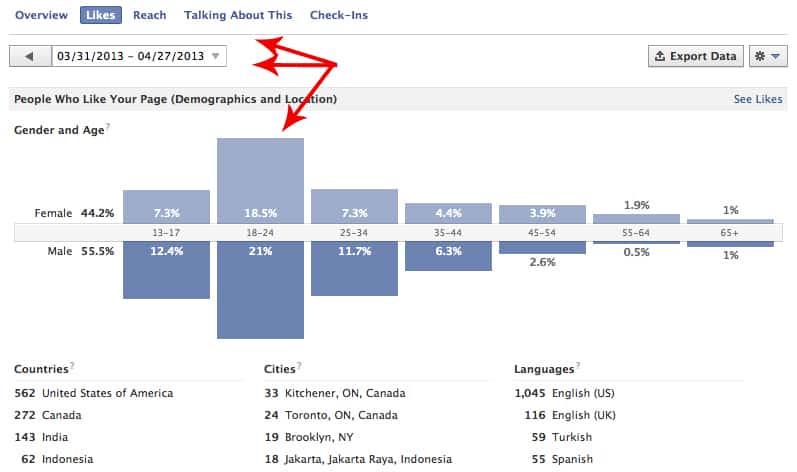
On this page of your analytics, you can choose the data you’re looking to view; Likes, Reach, People talking about this or check- ins. The unique feature here is that you can select a specific date range that you’re looking to gather information for. After your dates are selected, you can view data containing the male to female ratio viewing your content, which parts of the world they are from, and the amount of Like and Unlikes your page has received.
The Demographic Breakdown
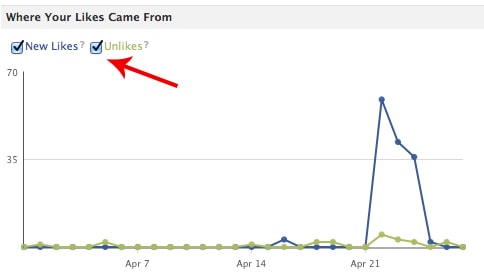
To make viewing easier when looking at the Like/Unlike section, you can uncheck which one you do not need at that time; this gives the chart a more clear picture to follow.
Likes and Unlikes
Reach
Reach is defined as the total amount of “unique” users viewing your post. Not only can you determine how many people have seen your post, but if you dig deeper you can view the most reached post and the amount of engagement created within those viewers. Monitoring the Reach component in your data will help you determine the content material that is receiving the most Reach, allowing you to look back at what you did within that content and continue those strategies.
Engaged Users
The most Engaged Users are not necessarily the most Likes, Shares and Comments. The Engaged Users metric is actually determined by the amount of people clicking on your post. Although your followers may not have Liked, Shared or Commented on your post – they are clicking and being directed to where you want them to go. That’s a success.
Talking About This
Now this is where we get into the exciting Likes, Shares and Comments. When you view your Talking About This metrics, you are referring to the amount of people who are creating stories through your posts. By Liking, Commenting or Sharing your content, these followers are creating conversation with their followers, as well as yours. If you find these metrics slipping, change up your content – or refer back to past content that had positive metrics in this category and learn from those strategies used.


